kth90
13 June 2025 15:28
1
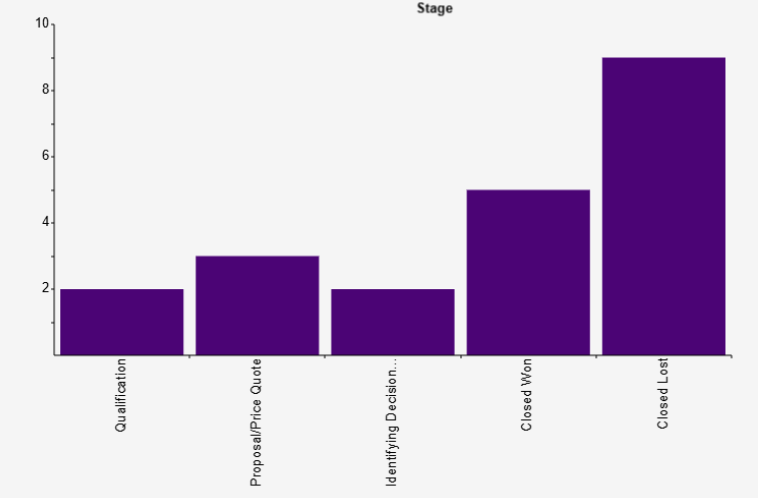
I’m checking out the charts on the reporting, on this chart I have the ‘Grouped Bar’ selected
I have the Opportunity Amt in the Y-Axis, and the Sales stage on X-Axis
I was under the impression of it would list the amount on the y-axis but it looks like this is just counting the number of opportunities on each sales stage
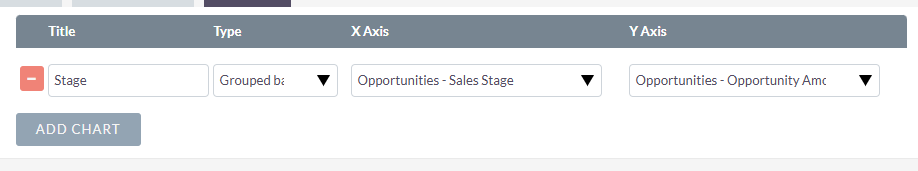
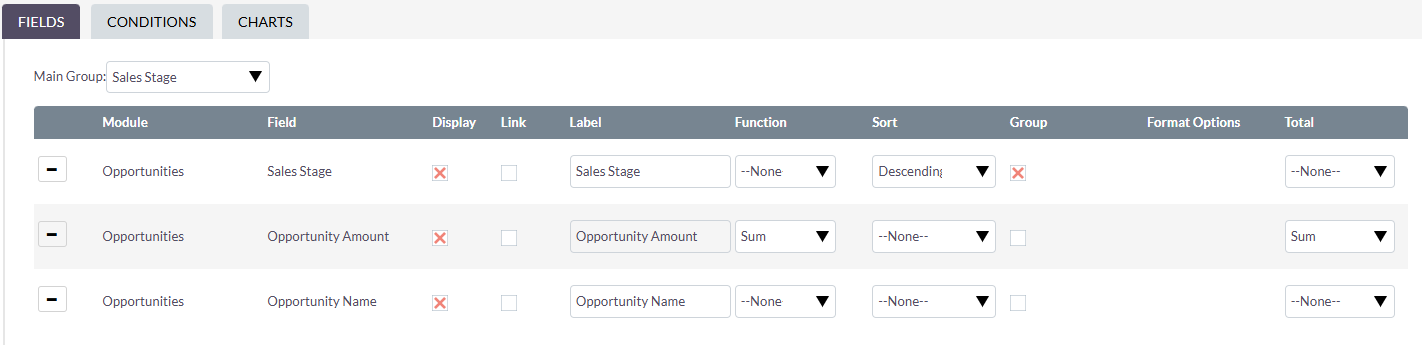
This is how I have the report setup as well if it helps
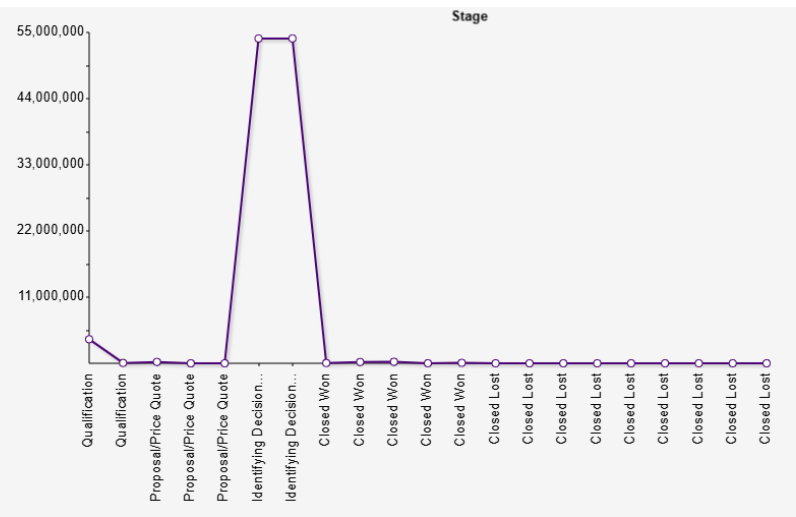
It shows when its a Line chart but just not on bars
What am I doing wrong here?
We have version 8.8.0
Even I am getting the same issue when I select grouped bar chart.
I have a similar issue in v8.9.2: Stacked bar chart showing count of group-by fields rather than the sum value.
I think I’ve found the problem in public/legacy/modules/AOR_Charts/AOR_Chart.php
In getRGraphGroupedBarChartData, the values are being counted (+ 1) , not summed
foreach ($values as $key => $value) {
            $_data[$label][$tooltips[$label][$key]] = ($_data[$label][$tooltips[$label][$key]] ?? 0) + 1;
        }
Changing this to sum the $value fixed my stacked chart:
 foreach ($values as $key => $value) {
            $_data[$label][$tooltips[$label][$key]] = ($_data[$label][$tooltips[$label][$key]] ?? 0) + $value;
        }
I think this is possibly the fix for: Stacked & grouped bar charts show 1 value instead of actual count · Issue #10412 · SuiteCRM/SuiteCRM · GitHub .