I’ve installed several SuiteCRM instances since years on VPS and shared hosting and it was always acceptably quick.
On one new shared hosting environment I’m running a small and fast website (Google Pagespeed 98 on mobile) and SuiteCRM 8.3 (new installation with 2 leads manually created).
One page load takes around 83 seconds
PHP 8.0
MySQL 8.0
opcache.enable true
max_memory_limit 512M
no 404 / 403, everything loads nicely - just very slow
suitecrm.log is almost empty
Wed Jun 28 06:56:03 2023 [2477233][1][FATAL] Mysqli_query failed.
Wed Jun 28 06:56:03 2023 [2477233][1][FATAL]  Query Failed: SELECT favorites.*
                  FROM favorites
                  JOIN config ON ( config.id = favorites.parent_id )
                  WHERE favorites.assigned_user_id = '1'
                    AND favorites.parent_type = 'Administration'
                    AND favorites.deleted = 0
                    AND config.deleted = 0
                  ORDER BY favorites.date_entered DESC LIMIT 0,10: MySQL error 1054: Unknown column 'config.deleted' in 'where clause'
Could that be related to a very slow system?
I’ve moved the DB to my VPS (with another SuiteCRM running swiftly and connected to that one - but the speed is the same. VPS with 10GB RAM, very little traffic, MariaDB - and still the same issue.
On the shared host, there is a
Apache 2.4
NGINX reverse proxy
Caching enabled / disabled for testing purposes (all without changes / improvements)
The shared hosting company was quite helpful on the phone, but couldn’t see an issue as well.
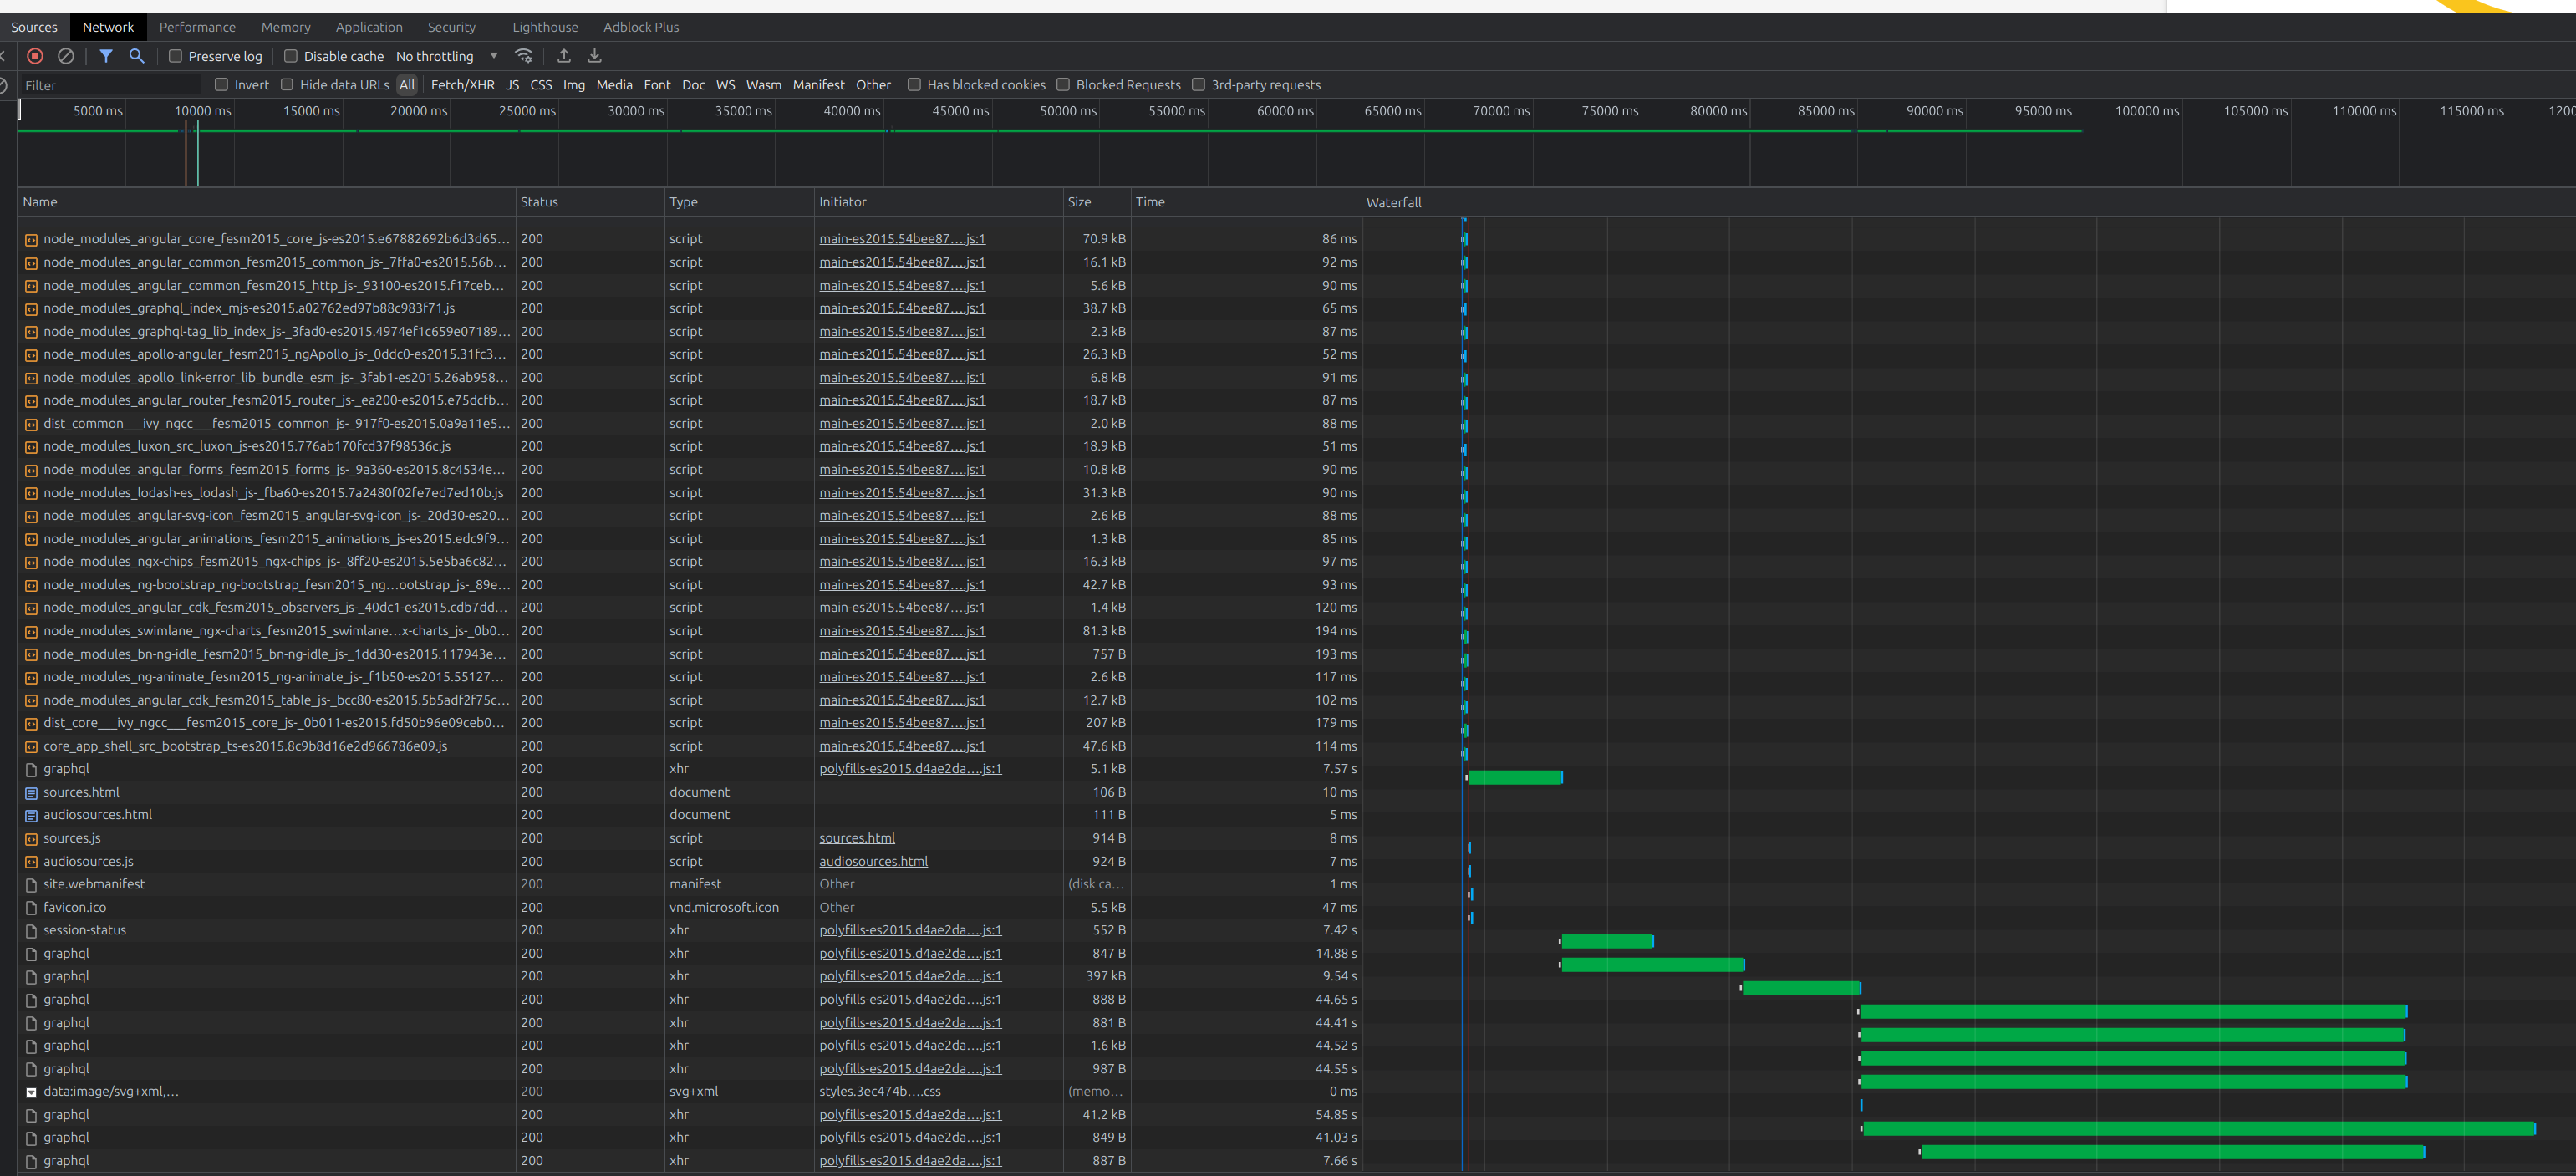
In the browser, it seems like, most things load fast BUT the graphql endpoint:
I’m struggling with the same thing, with SuiteCRM 8.1. I have done the following so far:
(a) Checked and changed permissions of folders as required.
(b) removed errors that were showing the log
(c) Repair and rebuild
Nothing so far.
The server environment is perfect, I have other apps working on it fine. Here are some detials:
|Apache Version|2.4.57|
|MySQL Version|5.7.42|
|Architecture|x86_64|
|Operating System|linux|
|Shared IP Address|103.187.238.34|
|Path to Sendmail|/usr/sbin/sendmail|
|Path to Perl|/usr/bin/perl|
|Perl Version|5.16.3|
|Kernel Version|3.10.0-962.3.2.lve1.5.39.el7.x86_64|
The CPU, Memory etc are almost idle.
Enabling slow log does not show anything in the log. The loading animation shows for almost 10 second after each click - which is really bugging.
I have no idea. Try it. At least it’s always a good idea to remove FATAL errors, they stop script execution, so you never know what else is broken until you remove them…
What happens at the /api/graphql endpoint?
What could it be, when it takes 20 and more seconds to load?
All CSS / JS load instantly, only the graphql takes very long?
@pgr I’ve applied the patch - FATAL error is gone, performance is still bad.
Don’t know, some web server configuration thing… maybe related to the mod_rewrite.
I know that turning on opcache makes a big difference in terms of performance for v8, but it should never be taking 20 seconds in the first place, on a system that’s not loaded with activity from multiple users, so there’s probably something else going on here.