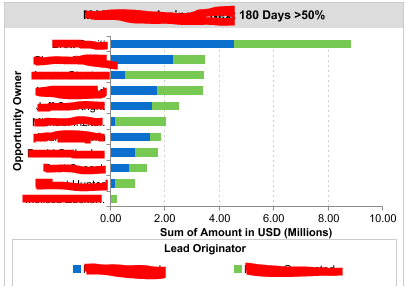
Looking to build a bar chart like the one below. I have three data points within the Opportunities module (Assigned User, Amount and Type) I would like to use. I’d like to list the assigned sales person grouping all the Amount fields into the bar that is then segmented by type. Tried using Spots and the Reports module and can get everything to sum into the bar by assigned user just fine. It’s the segmentation to the actual bar by Type that I am having trouble with. Anyone successfully able to build this similar to the default dashlet chart “All Opportunities By Lead Source By Outcome”