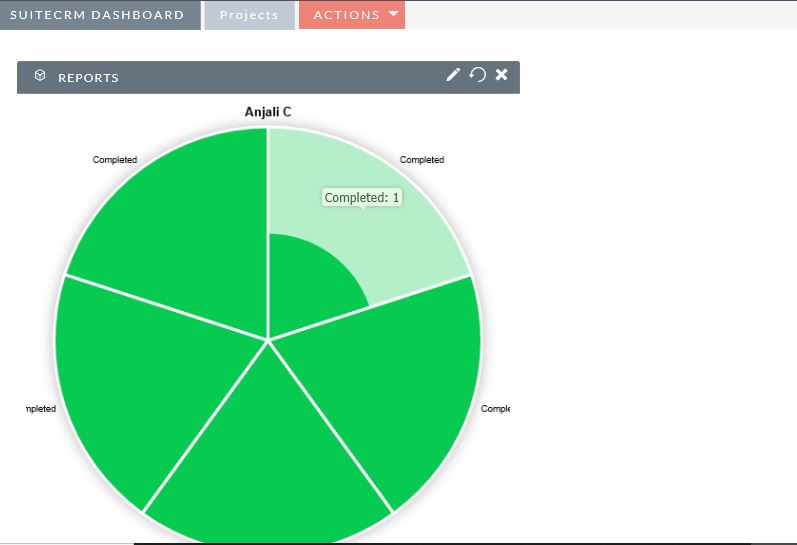
Can you help to show Pie chart properly. I am not able to fetch exact details which i want to show in pie chart.
Currently it is showing that, one by one status data. I want to see data of all status in this pie chart. Example
Completed - 4
Inprogress- 2
POC Started- 2
Demo Pending - 1
Then this pie chart should be divided in 4 parts and it should show 4 status -
Any help ?
Could you send a screenshot of your report which this is based on?
Hi Mac, Can you see this attached image.
Hi there,
So im not the only one looking into this im going to turn this thread into a public topic
I am fine with it, u may globalize it. But pl assist to show reports in better way.
Hi,
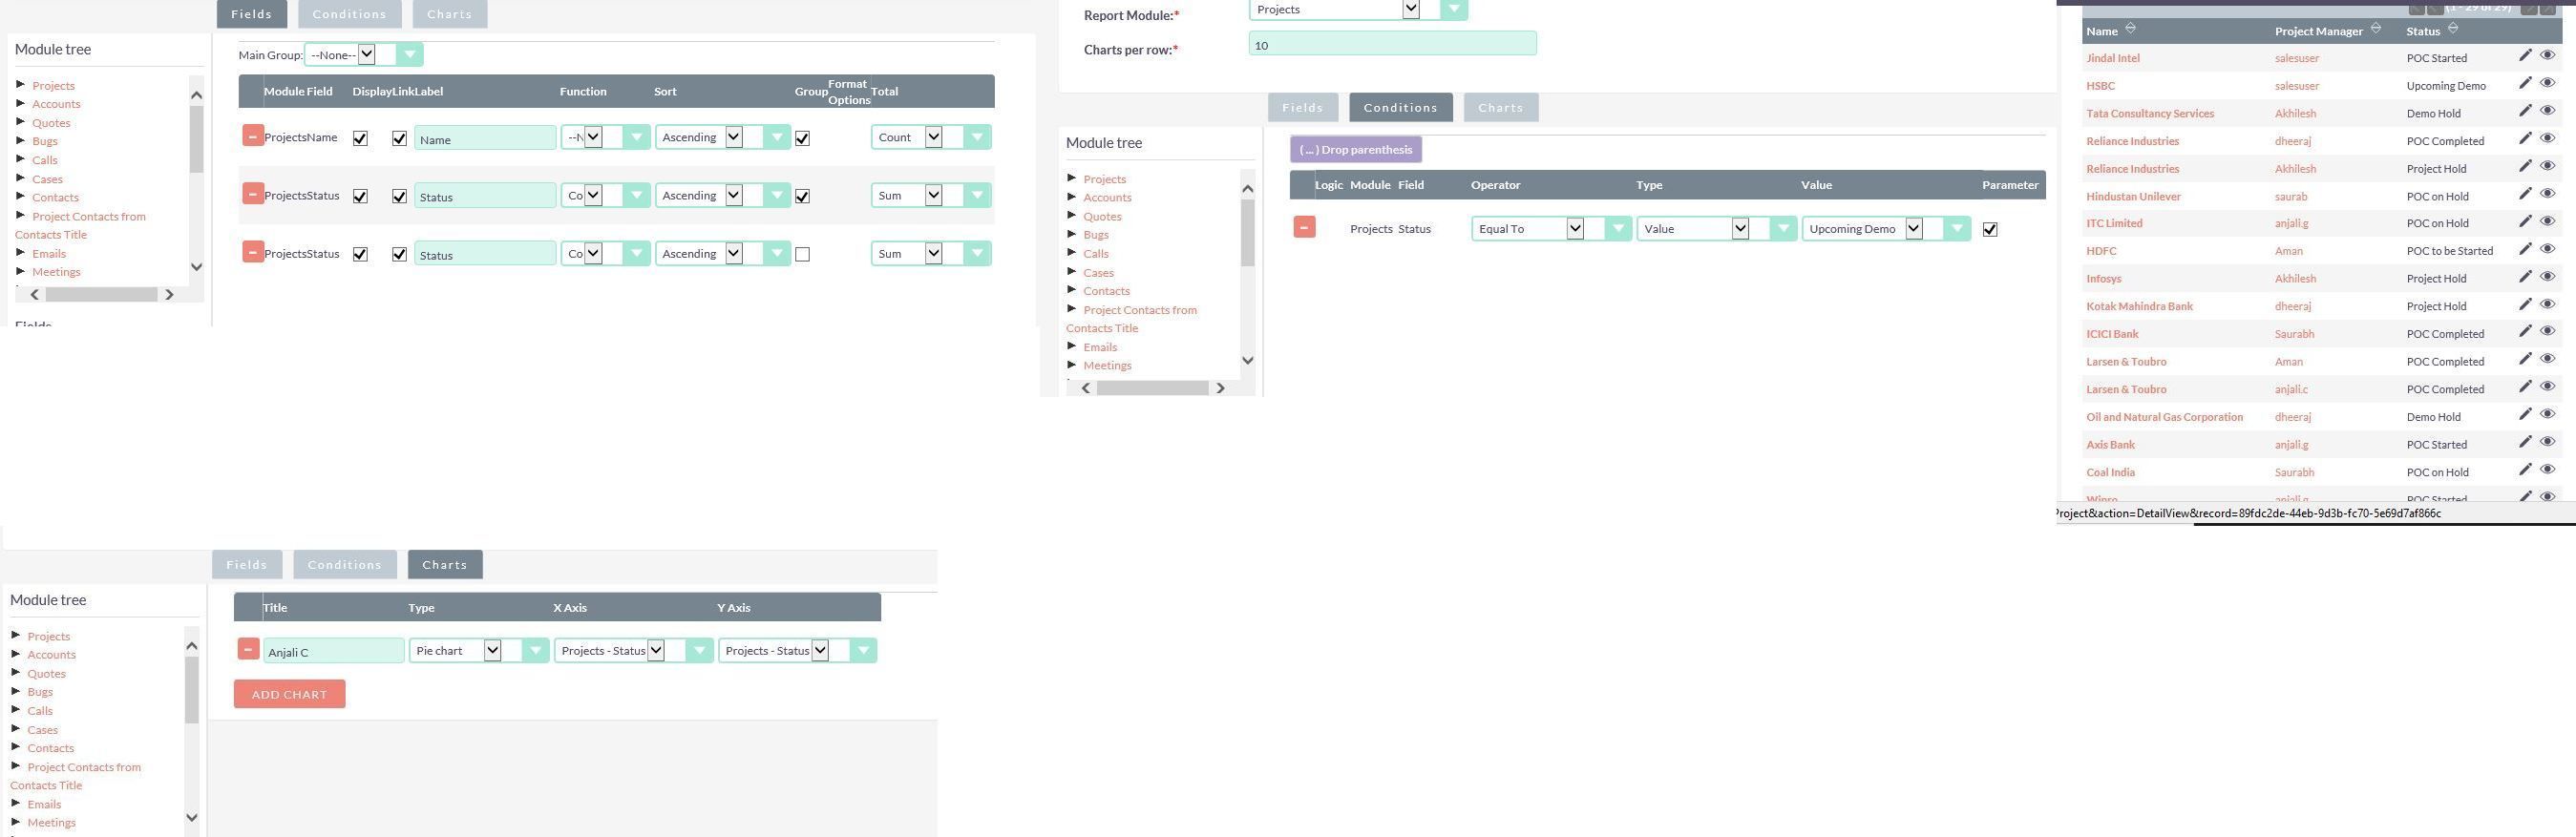
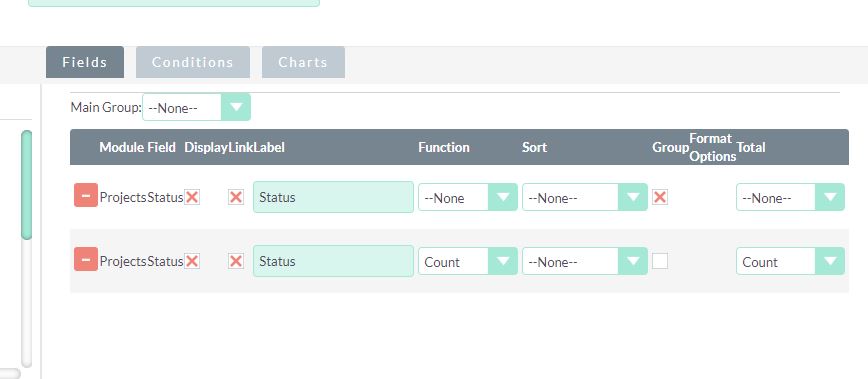
select ProjectsStatus twice and deselect the name - you do not need it for the shown pie chart.
Set the two fields up like this:
- first Status field:
- “Display” checked, Function: none, sort none, “group” checked
- second field:
- “Display” checked, Function: count, “group” unchecked.
Try testing first without further conditions (you can add them later). In case the chart is not shown, try switching the values for the x-/y-axis.
Not working in this way. Can you help me over team-viewer or any-desk ?
Any helps ? i am not able to see perfect pie chart as per my requirement
Hi,
sorry, I’m out of ideas - what I posted before is working usually. Have you tried switching the axes in the chart?
yeah i did it, not works. can you help me over team-viewer or any-desk ?