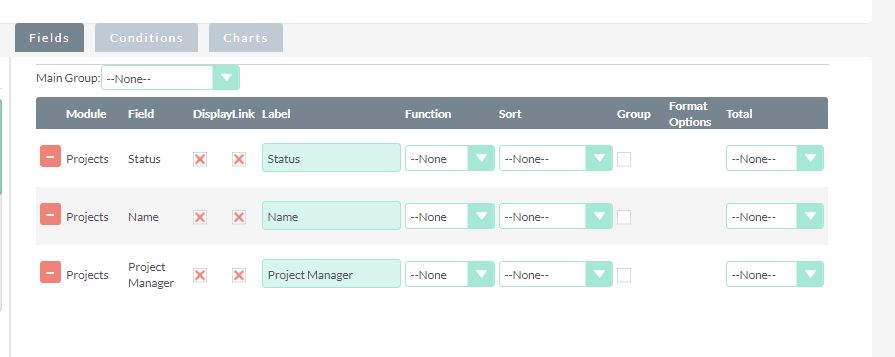
Hi, Below path i have followed, Created few projects, assigned to different different users, went to Reports section, create reports, select projects from tree module, Add field and went to charts, give title and select PIE charts and provide x axis and y axis.
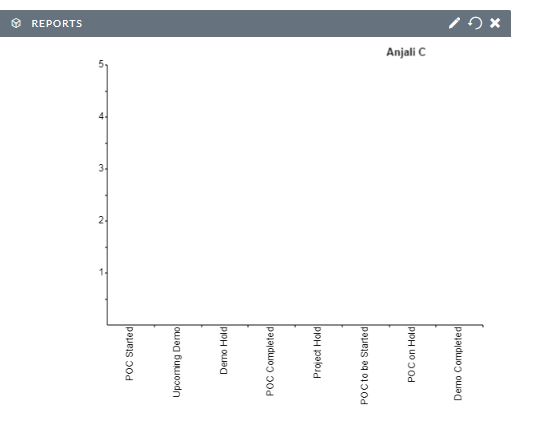
Now, i went home dashboard, actions, add dashlets, select reports from module. But its not showing any reports. Please help.
I am trying to setup reports for all my projects which is happening around. I am able to see all status as x axis, not able to see Name of all projects on Y Axis.
Like if i am having 10 projects, and 5 projects is having in progress, 2 , 2 and 1 is having different status. Its not showing starts with y axis details, i can see status bar and name but not count over 7 axis
For ref - I am attaching file. Please help me what are the appropriate changes needs to be done to appear y axis data.
NOTE - If i am trying to enable count, NO results is displaying.