PGR,
Would this work with the Google SANKEY Chart?
Thanks,
CM
PGR,
Would this work with the Google SANKEY Chart?
Thanks,
CM
That’s exactly what it is, a Google sankey chart. You can see it in my post above, and you can see the code used to generate it.
Hi everyone,
I am trying to add a Google chart but ran into a problem. When I add one chart, everything works fine. But when I try to create more than one chart, I can get javascript conflict error and the dashboard goes crazy. To clarify, I am not adding 2 charts from one dataset. I basically replicated the instructions above twice for 2 different charts with 2 different data query.
Looking forward to getting your advice 
I have a working example with both a chart and a table (also rendered by Google), also from the same data, so it should be the same as your case. After setting all the properties on the graphs this is how it ends:
        // Instantiate and draw our chart, passing in some options.
        var chart = new google.visualization.Sankey(document.getElementById('chart_div'));
        chart.draw(data, options);

        var table = new google.visualization.Table(document.getElementById('table_div'));

        table.draw(data, {showRowNumber: true, width: '100%', height: '100%'});

      }
   </script>

<body>
<div style="zoom: 1.0; -moz-transform: scale(1.0); transform-origin: 0 0; -moz-transform-origin: 0 0">
    <!--Table and divs that hold the charts-->
    <table class="columns" align="center">
      <tr>
        <td><div id="chart_div" style="border: 1px solid #ccc;"></div></td>
      </tr>
      <td><div id="table_div" style="border: 1px solid #ccc;"></div></td>
      </tr>
    </table>
</div>
  </body>
Thank you very much for your reply.
I apologize for the confusion. I basically followed your instructions posted on “5 Oct 2018 12:48” and created 2 different charts. So I repeated your steps 1 to 5 twice. Meaning, I created two entry points, two different google chart files, 2 different dashlets and maybe because of this, I get Javascript conflict (Dashboard keeps reloading and not working).
I am trying to have 3 google charts,
Kindly, let m know if I can achieve what I want by following your steps and repeating them 3 times? and how do I solve the Javascript conflict?
I don’t know, I never tried it, but…
Are you giving different names to the Javascript variables, and to the divs?
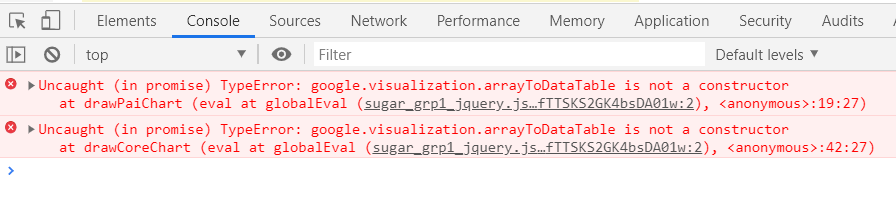
What errors do you see in your browser’s Javascript console?
You’re messing up your Javascript. ArrayToDataTable is a static method, a helper function, not an object that you can instantiate with new
https://developers.google.com/chart/interactive/docs/reference#arraytodatatable
It would be easier to help you if you shared your entire code.
Hi @pgr so sorry for the late response. Here is what I have done.
So I have followed your instructions above and created 2 different entry point:
File 1: custom/Extension/application/Ext/EntryPointRegistry/googleCharts1.php
File 2: custom/Extension/application/Ext/EntryPointRegistry/googleCharts2.php
(I actually need to create multiple charts using Google chart but the data will have to be different)
and then I created the following chart files in (/custom/charts):
Sorry couldn’t copy the code here as it wont let me.
Thanks a lot for your help with this.
Focus on the name chart_div. You can’t repeat that for both charts, if they’re showing in the same page.
The id of the div you specify in the HTML part:
<td><div id="chart_div" style="border: 1px solid #ccc;"></div></td>
… must match what you tell the Google visualization object to use:
var chart = new google.visualization.ColumnChart(document.getElementById("chart_div"));
Then, for the second chart, change both of those: a new div id in the HTML, and that same id is passed to the visualization object.
You can paste code here by enclosing it in triple-backtick tags, like this:
```
code
```
That’s really  , yes!
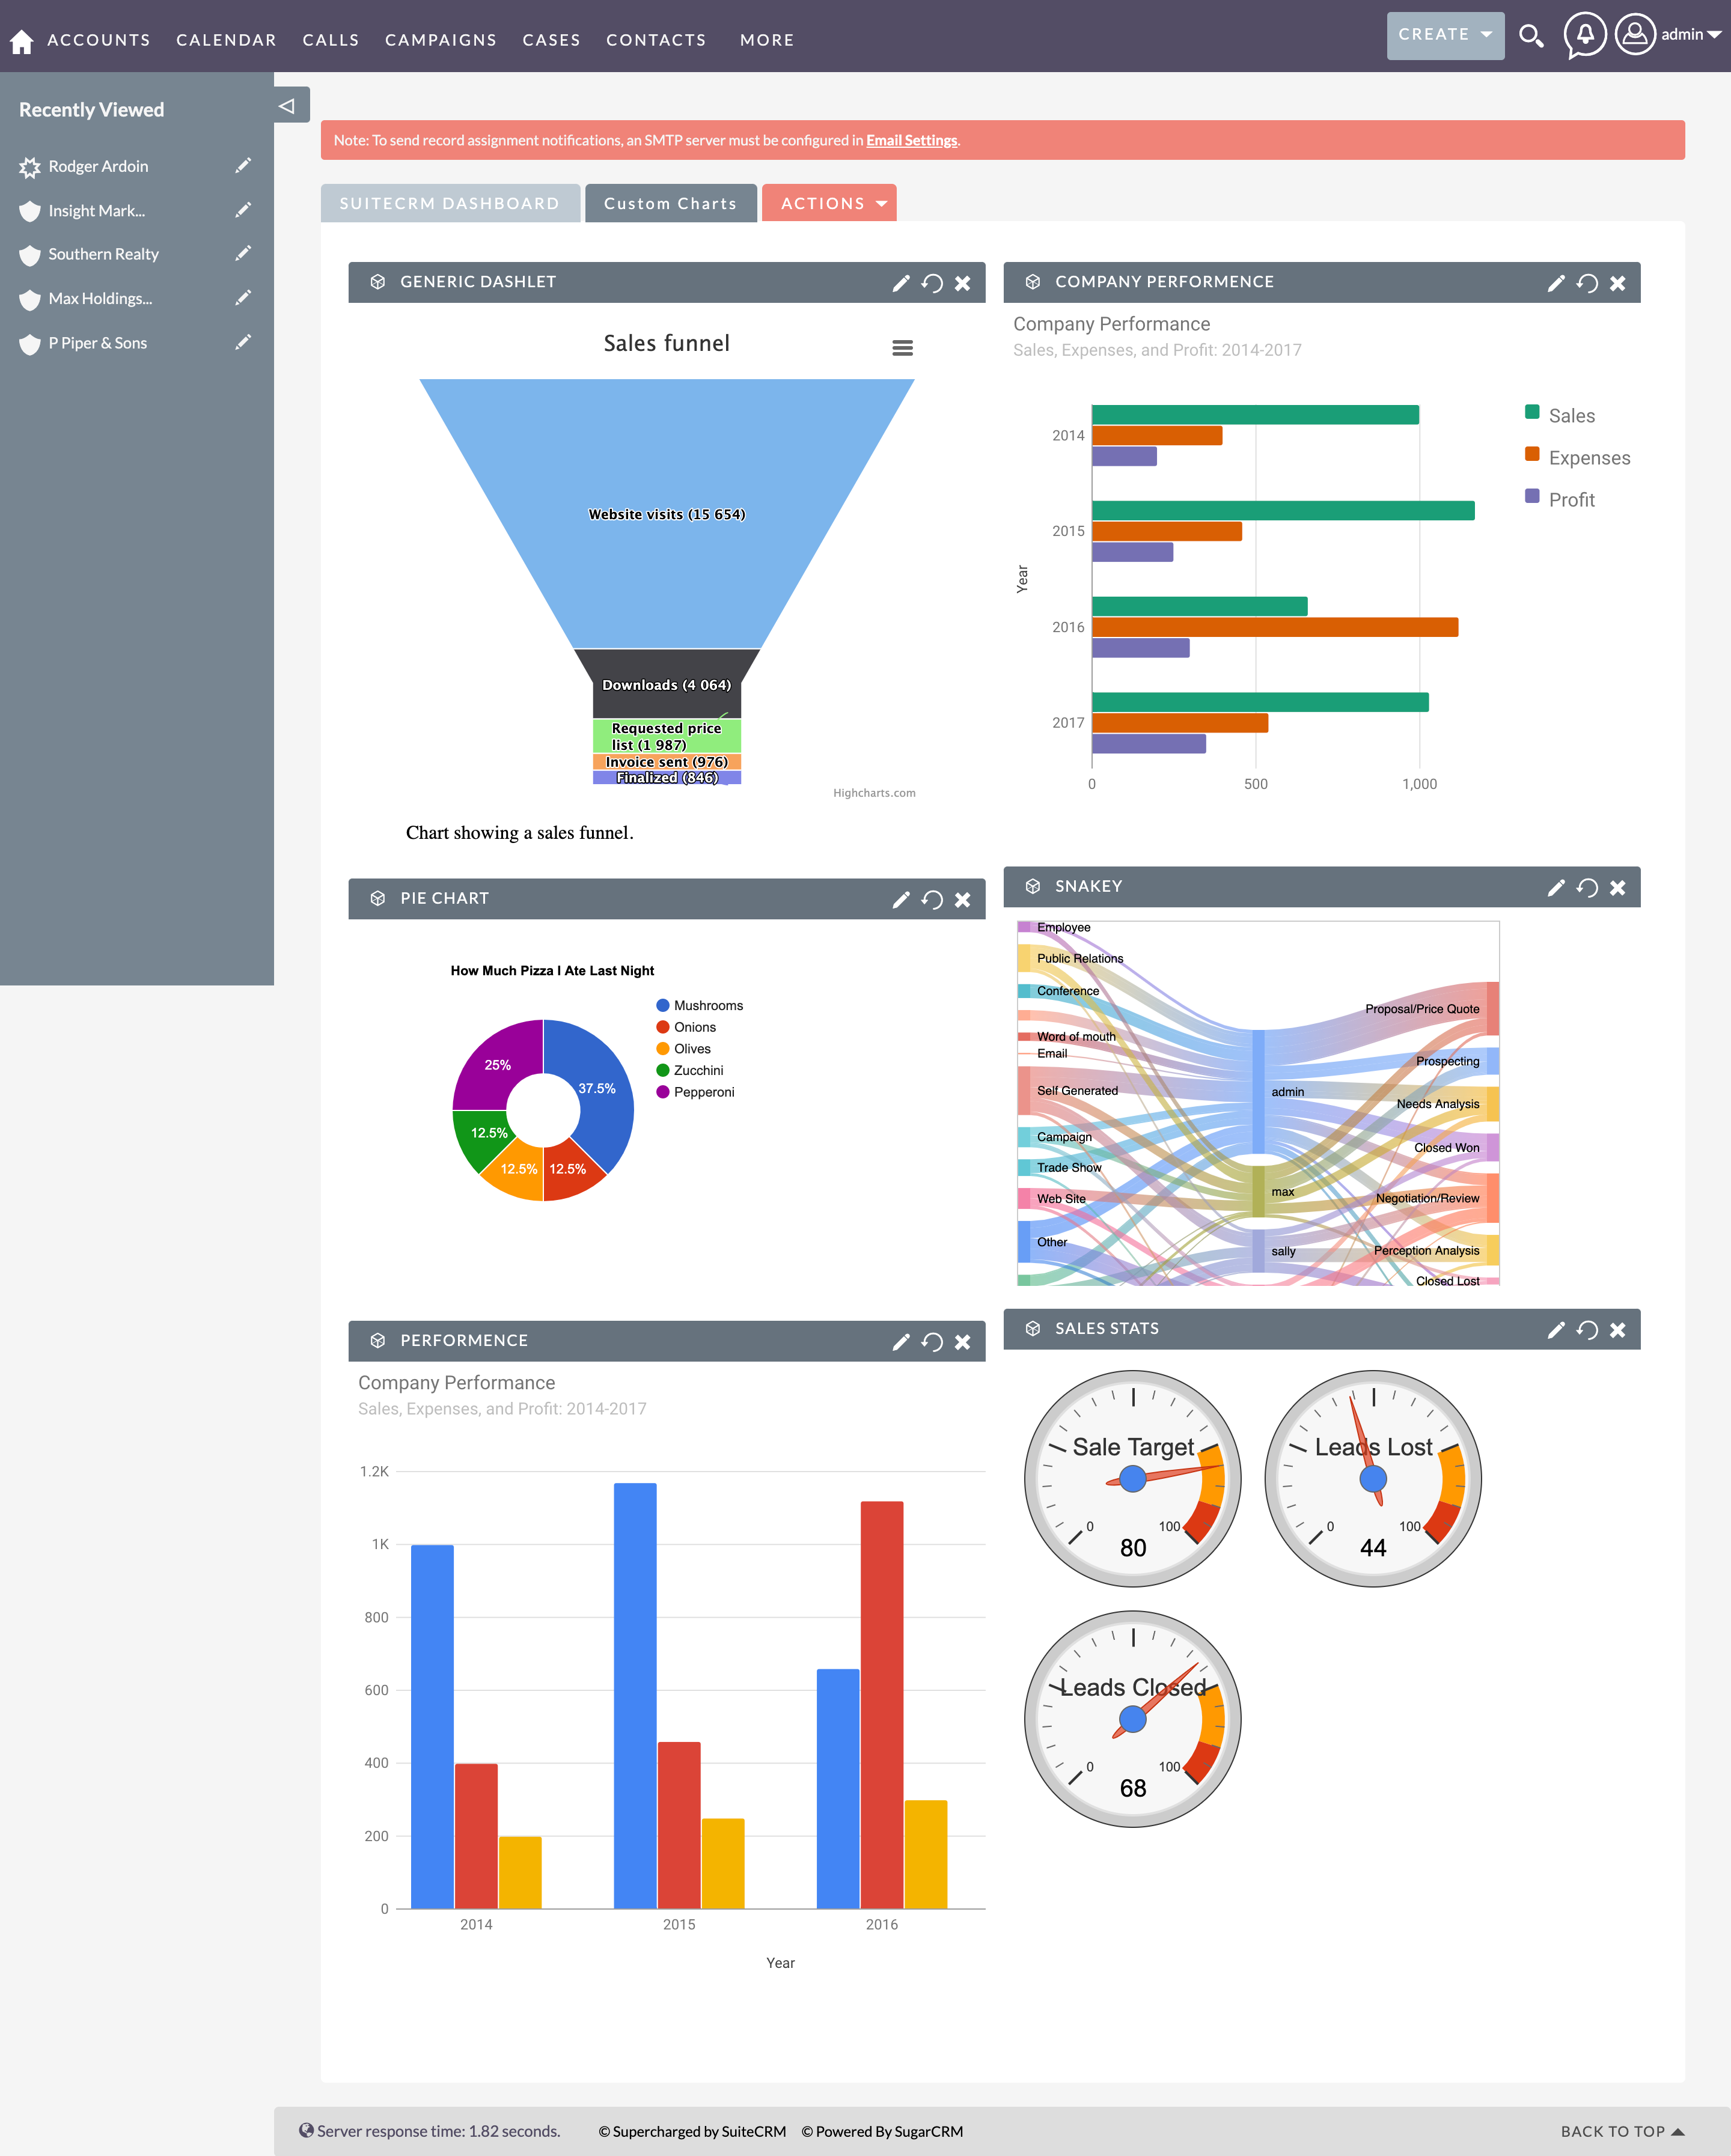
I love your typo: instead of Sankey graph, you called it a Snakey graph… which actually describes it a lot better 
@pgr THANK YOU VERYYYYYYYYYYYYYYYYYYYY MUCH. It worked
I wanted to ask a little extra help with database queries to get the following charts:
I am not very familiar with DB queries so would really appreciate your help.
Also wanted to ask your opinion on:
I can get the reports with build in reports and chart and apply necessary filters but can’t figure out the DB queries to build google charts. Is there an easy way find what DB queries is being used after I create an report?
I’m glad you got it working.
I don’t have much time to look at your questions right now, but this should be enough: put your log level at DEBUG in Admin / System settings, then every query should be in the logs. You can run the reports and get the queries.
This might also help if you want to understand things better:
Hey All, I know this is an old thread, but hoping someone who’s tried this can chime in. First THANK YOU to all in this thread, I tried this out and it works great. So easy!
However, I have an installation for a client that I keep getting: "Incorrect website location is specified
" in the dashlet. It works in the browser OK, just not the dashlet. I’ve done this in other installs and it works fine. I inspected the display() function that drives the URL check and it looks to me like it only checks it’s in the format https:// or http:// (which it is), it shouldn’t even matter if it resolves. I’m kind of stumped, anyone have any ideas?
hmm, I found this in: modules/Home/Dashlets/iFrameDashlet.php
It prevents this from working! It’s not in my install but happens to be in the latest code on Github too.
If you are pasting in an internal URL like to a entryPoint it will always return true and then blank out the URL and the dashlet won’t work. Not sure why this was added?
 if (isSelfRequest($this->url)) {
            $this->url = '';
Anyone know why this was added? Going to ad a bug on github. I can’t see why this is necessary or what it’s purpose is?
I’d say it’s a security measure. I’m just guessing, but there’s probably a way to hijack SuiteCRM from within dashlets if you bring in malicious web content, and this helps prevent it.
Probably the security measure can be improved. One way to do it would be to use the entryPoint registry as a white-list.
@pgr that’s what I was thinking (that’ s the only logical explanation I could come to!). I’ll have a look at the “isSelfRequest” function and see if I can add an exception for URL contains “entryPoint=” or something like that.
That could be a good solution for you, but won’t be good enough as a generic solution, because it would be easy to just insert that string to get past the security check.
If the $entry_point_registry variable is available, we could check for those entries at the beginning of the URL, after the site_url part.
I’m wondering if we can check that the entry point is a valid entry point and get a list of entry points that exist. Something like that. Who knows, maybe this was instituted to prevent iframe of entry points? Not sure what the exact security issue was as it’s not public. Maybe the dev who did this on Github will comment on my issue there.
I guess I could create a custom dashlet too that displays the iframe, but maybe that would be subject to the same constraint, not sure until I try.