How create report

how to create report like this:
I need to have a graph of the opportunities of the current month by seller
these are the fields

These are the filters or conditions

graph configuration

Outcome

I need you not to repeat the names of the commercials, and add the total of those opportunities
example
image

Hi,

I think you might be able to get closer by doing the following:

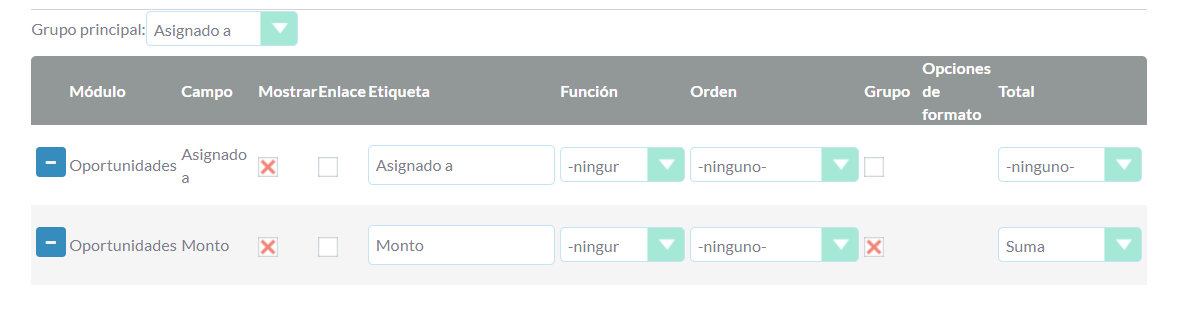
Under “función”, for the “Monto” row, set the value to “Suma”
Under “Grupo” for the “Asignado a” row, check the checkbox
Under “Grupo” for the “Monto” row, uncheck the checkbox

The above changes should Group the report by User & total the Amount of each item per user


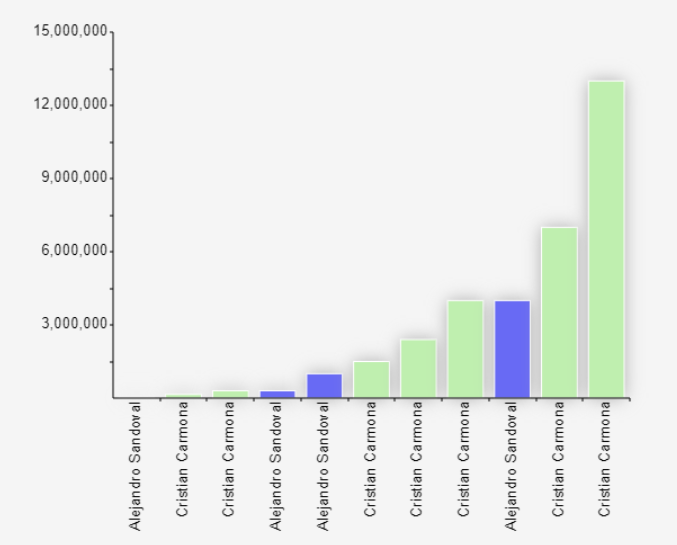
If you make the above changes, how does the report look?
Is it closer to what you’re looking to achieve?

93/5000

Everything works correctly

How do I show the total amount of all opportunities

Hey,

I can’t think of a way to show that on the same chart

But you might be able to add a new field & chart to achieve this

If you:

  • Add the “Deleted” field to the Report’s “Fields” section
  • Under “Display”, uncheck this checkbox. (This hides the value on the report, but it can be used in charts)
  • Under “Group”, check this checkbox

Like so

Then, in Charts, add a “Stacked Bar” chart

  • Select “Deleted” as the X Axis
  • Select “Amount” as the Y axis again

You get something like this:
image

Is this closer to what you’d like to see?