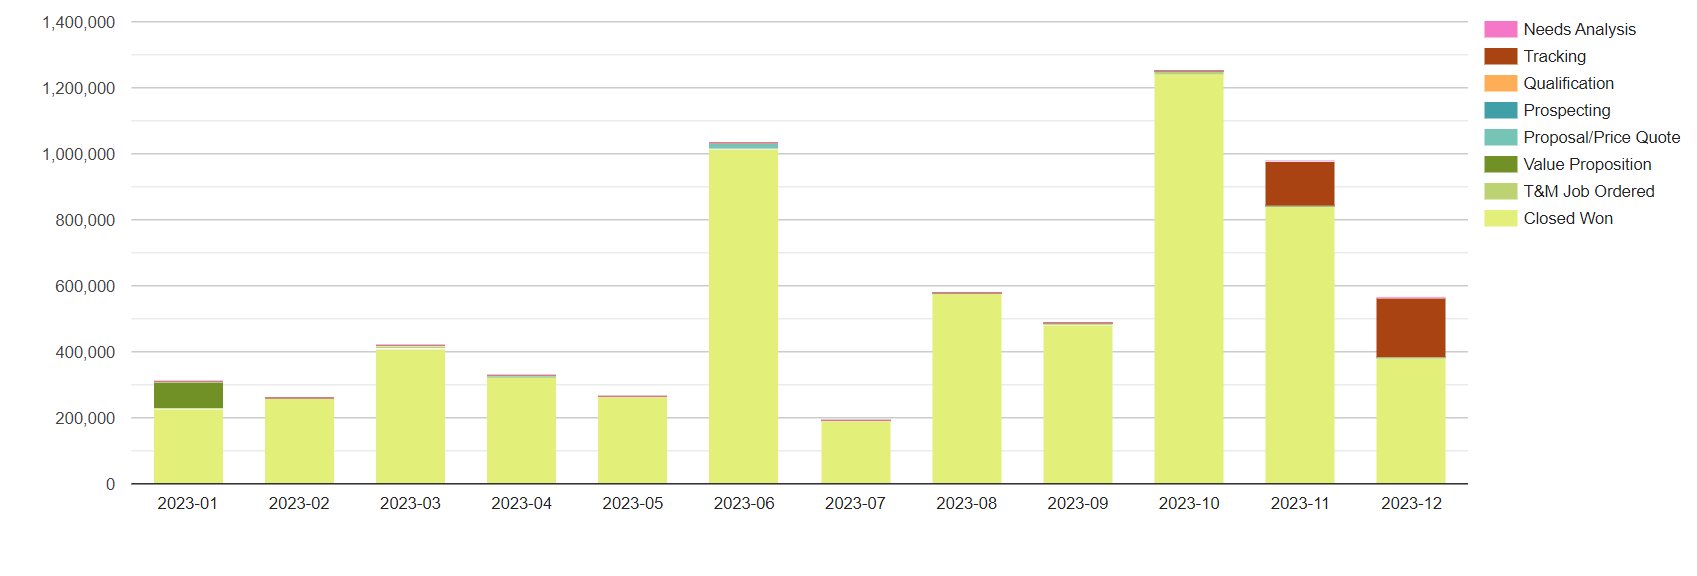
We’re creating a stacked-bar chart using Gooogle Charts plugin (shown below). Now, we want to make it interactive for users. If a user clicks on legend value, it should turn off that particular value from series and update chart according to it. Also, when user clicks again on same legend value, chart should get that value back. So, we want to add functionally of toggling series and display chart accordingly.
If anyone worked on this before, please let us know. Thank you for help!
