OSiUX
4 March 2024 22:49
1
Hello everyone! I am OSiRiS , also known as OSiUX and I work in gcoop Free Software Cooperative , where we develop CRM from the 2007.
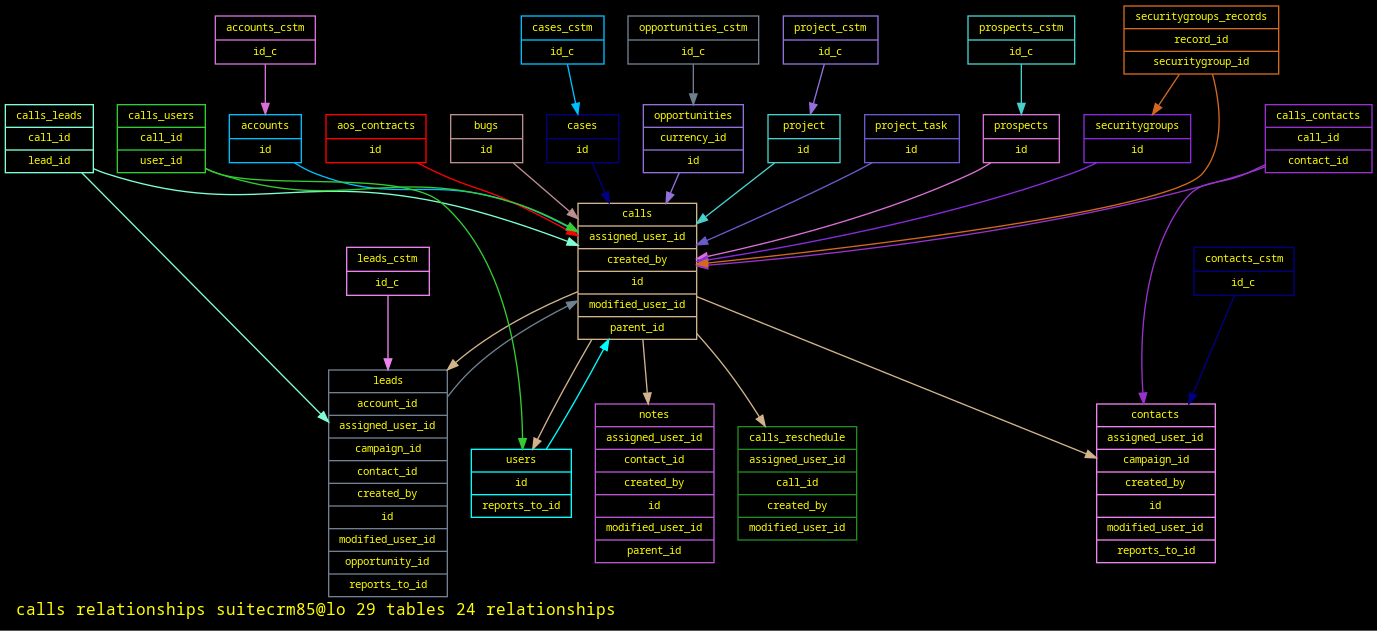
After migrating 6300 hosts a GNU/Linux I am resuming the implementation of a SuiteCRM project and to catch up I recovered from the WayBackMachine a backup copy of sugar-graphiz, a script that originally autogenerated an Entity Relation Diagram from the table relationships from a SugarCRM database and I didn’t have to adjust a lot for a SuiteCRM 8.5 instance to graph
I share the project in case anyone is interested, the script It is GPL and I accept suggestions and improvements, in principle I am going to do it more readable to the code and add Markdown support, originally used ReStructuredText
3 Likes
I have something similar. Due to not much time, I just attach it here. Maybe you can take inspiration from it, but yours look cleaner on first look.
<?php
if (!defined('sugarEntry')) {
define('sugarEntry', true);
}
?>
<!doctype html>
<html lang="en">
<head>
<meta charset="utf-8">
<title>Sugar Schema</title>
<script src="https://cdnjs.cloudflare.com/ajax/libs/viz.js/2.1.2/viz.js" integrity="sha512-vnRdmX8ZxbU+IhA2gLhZqXkX1neJISG10xy0iP0WauuClu3AIMknxyDjYHEpEhi8fTZPyOCWgqUCnEafDB/jVQ==" crossorigin="anonymous" referrerpolicy="no-referrer"></script>
<script src="https://cdnjs.cloudflare.com/ajax/libs/viz.js/2.1.2/full.render.js" integrity="sha512-1zKK2bG3QY2JaUPpfHZDUMe3dwBwFdCDwXQ01GrKSd+/l0hqPbF+aak66zYPUZtn+o2JYi1mjXAqy5mW04v3iA==" crossorigin="anonymous" referrerpolicy="no-referrer"></script>
<script src="https://cdnjs.cloudflare.com/ajax/libs/vis-network/9.1.2/standalone/umd/vis-network.min.js" integrity="sha512-DOpf3tO7m7MJHkMMRRoNxiJL4CR+TFLYy2XnIOeTh26Hz8j8i9RHrVkXzh+AQ7mffzIFk538/zcQ3Yoo+7VISA==" crossorigin="anonymous" referrerpolicy="no-referrer"></script>
</head>
<body style="padding:0px; margin: 0px;">
<div id ="vibuttonleiste" style="padding:2px; margin: 0px; width:100%; height:21px; background: #ddeedd; border: 1px solid #222222;">
<a href="sugarSchema.php?type=graphviz">Graphviz</a><a href="sugarSchema.php?type=graphviz&filter=nxonly">(nxonly)</a>
<a href="sugarSchema.php?type=visjs">Vis.js</a><a href="sugarSchema.php?type=visjs&filter=nxonly">(nxonly)</a>
</div>
<div id="networkgraph" style="width:100%; height:1200px">
</div>
<?php
foreach (glob("metadata/*.php") as $filename) {
require_once $filename;
}
foreach (glob("custom/metadata/*.php") as $filename) {
require_once $filename;
}
$nodes = [];
$edges = [];
$graphviz = "digraph G {";
foreach ($dictionary as $name => $relations) {
if (isset($relations['relationships'])) {
foreach ($relations['relationships'] AS $relationname => $relation) {
if (empty($_GET['filter']) || ($_GET['filter'] == "nxonly" && substr($relationname, 0, 3) == "nx_")) {
if (!in_array($relationname, ["aok_knowledgebase_categories", "aow_processed_aow_actions", "jjwg_maps_jjwg_areas", "jjwg_maps_jjwg_markers",
"project_task_project_tasks", "surveyquestionoptions_surveyquestionresponses"])) {
//print "LHS-module: {$relation['lhs_module']}\n<br/>";
//print "RHS-module: {$relation['rhs_module']}\n<br/>";
$graphviz .= "{$relation['lhs_module']} -> {$relation['rhs_module']} [dir = \"both\"] ";
// label = \"{$relationname}\" color = green
$nodes[$relation['lhs_module']] = [
"id" => $relation['lhs_module'],
"label" => $relation['lhs_module'],
"group" => (substr($relation['lhs_module'], 0, 3) == "nx_" ? "nx" : "stock")
];
$nodes[$relation['rhs_module']] = [
"id" => $relation['rhs_module'],
"label" => $relation['rhs_module'],
"group" => (substr($relation['rhs_module'], 0, 3) == "nx_" ? "nx" : "stock")];
$reltypes=["one-to-many"=>["label"=>"1:n","arrows"=>"from"],"many-to-many"=>["label"=>"m:n","arrows"=>""],"one-to-one"=>["label"=>"1:1","arrows"=>"from;to"]];
$relationtype=isset($relations['true_relationship_type'])?$relations['true_relationship_type']:$relation['relationship_type'];
$arrows=isset($reltypes[$relationtype])?$reltypes[$relationtype]["arrows"]:"";
$relationtypelabel=isset($reltypes[$relationtype])?$reltypes[$relationtype]["label"]:$relationtype;
$title="Name: {$relationname}\nJoin Table: {$relation['join_table']}";
$edges[] = ["from" => $relation['lhs_module'], "to" => $relation['rhs_module'], "label" => $relationtypelabel,"title"=>$title,"arrows"=>$arrows];
//print_r($relation);
}
}
}
}
}
//exit;
$graphviz .= "}";
if (empty($_GET['type']) || $_GET['type'] == "graphviz") {
?>
<script>
var viz = new Viz();
viz.renderSVGElement('<?php print $graphviz; ?>')
.then(function (element) {
document.getElementById("networkgraph").appendChild(element);
})
.catch(error => {
// Create a new Viz instance (@see Caveats page for more info)
viz = new Viz();
// Possibly display the error
console.error(error);
});
</script>
<?php
} else {
print "<script>";
print "var nodes = new vis.DataSet([";
foreach ($nodes as $node) {
print json_encode($node) . ",\n";
}
print <<<EOF
]);
var edges= new vis.DataSet([
EOF;
foreach ($edges as $edge) {
print json_encode($edge) . ",\n";
}
print "]);";
?>
var container = document.getElementById("networkgraph");
var data = {
nodes: nodes,
edges: edges,
};
var options = {
groups: {
nx: {color:{background:'#88ee88'}, borderWidth:1}
}
}
var network = new vis.Network(container, data, options);
network.on("stabilizationIterationsDone", function () {
network.setOptions( { physics: false } );
});
</script>
<?php
}
?>
</body>
</html>
1 Like
Nice! Thanks for sharing.
Just for the sake of completeness, there is this that I made a few years ago:
SchemaSpy tables and diagrams To learn about our database structure, with its tables and relationships, please visit the SuiteCRM Database Schema, generated with SchemaSpy.
General principles and sample SQL queries Some of the queries provided...
that links into this navigable schema:
https://schema--suitecrm-docs.netlify.app/schema/
This does not include custom modules like the one @OSiUX provides (although it could be adapted).
It is also a bit out of date, it’s v7 from around 2018, maybe.
1 Like
OSiUX
5 March 2024 14:52
4
Thanks for sharing Thanks for share , I’m going to inspect the code and see if I can do a merge.
OSiUX
5 March 2024 15:02
5
@pgr the site you made is excellent!, IT is very complete and navigable, my script generates the information of tables and columns in PDF , because some clients prefer PDFs
I’m going to take inspiration from the SchemaPy graph and add more information about fields and table relationships, although I must comment that my script has the advantage of using colors for each table and respect them in relationships, that helps a lot in understanding, especially all when there are many tables.
Thanks for sharing!
1 Like