Hi guys, whilst I come from a .net background Ive started toying with extending my suitecrm.
My debugging consists of sending logging messages and running, I’ve seen xdebug being bought up at times, not really using PHP environments is there a debugging tutorial out there in respect to suitecrm.
I assume I’ll need to set up a local copy of my instance also
xdebug
So far, I find convinient enough to use is xdebug + phpstorm. Just go the phpstorm’s setting and type ‘xdebug’ in search field, then tips will help you. In short: install xdebug on your dev server; install addon in your browser; start listening in IDE; start debugging session from browser; PROFIT.
Be warn, in order to use xdebug, you need keep files on your dev server and local copy (which you edit in phpstorm) in sync. This can be tricky if you love to swtich between heavily different git branches.
suitecrm.log
(I assume from your message that you already know this, so it is just for full answer.)
There is also “suitecrm.log” file in the root project directory.
Watching it for [FATAL] type messages - is a very good idea. Especially at the production server, so you can immediately detect if/when something goes wrong. Watch it by ‘tail’, or by some other fancy tool - your choice.
And naturally you can log messages by yourself, here is the docs:
php_errors.log
You can set up php so it will log php errors into a separate log file. Google for “how to enable php error log”.
This is like minimum suite to watching and/or debugging your system, IMO.
just wanted to add some details to xdebug in case anyone comes across this:
Firstly there is this tutorial from Jetbrains on how to do it.
Following these steps worked for me:
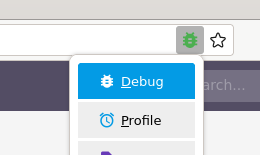
After installing xdebug on my local machine I activated the xdebug helper extension and in the extension settings set the IDE key to PHPStorm. After you enable debugging in the extension the icon should light up like this:
(If this doesnt work try a different browser for me only Firefox worked)
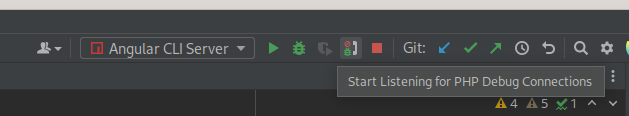
Then you have to enable Start Listening for PHP Debug Connections. Once you refresh your browser you should get a message asking you which file you want to debug.
Now when you set a breakpoint you get all kinds of debugging information.