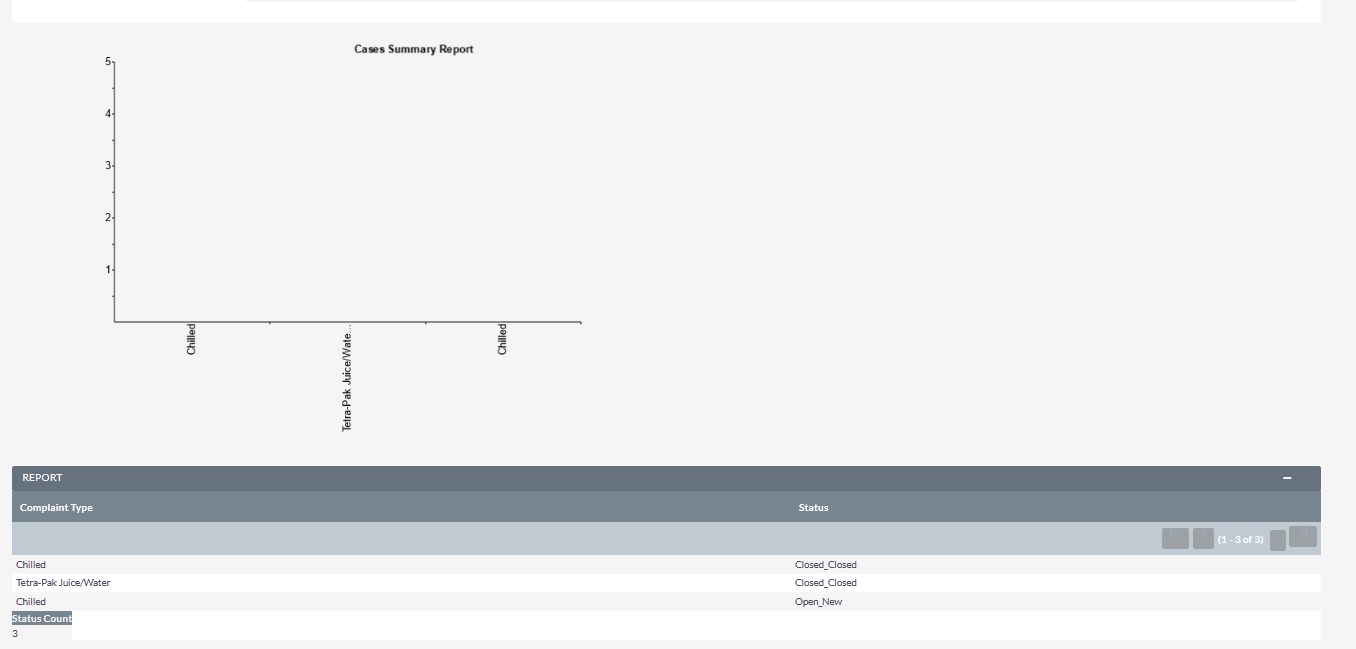
I’m trying to create report that creates a bar chart with the status and type of product but this is the results I’m getting
but I’m trying to achieve this
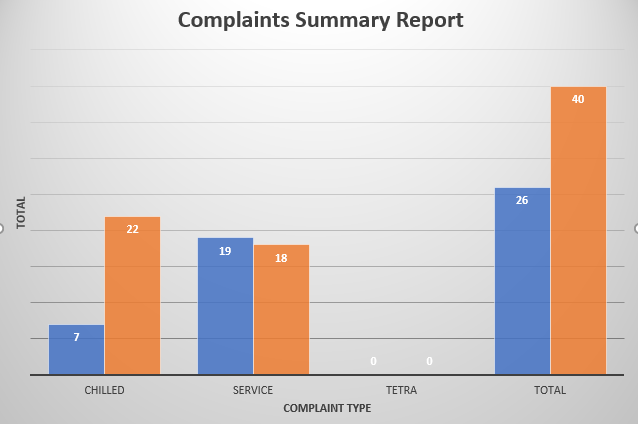
I’m trying to create report that creates a bar chart with the status and type of product but this is the results I’m getting
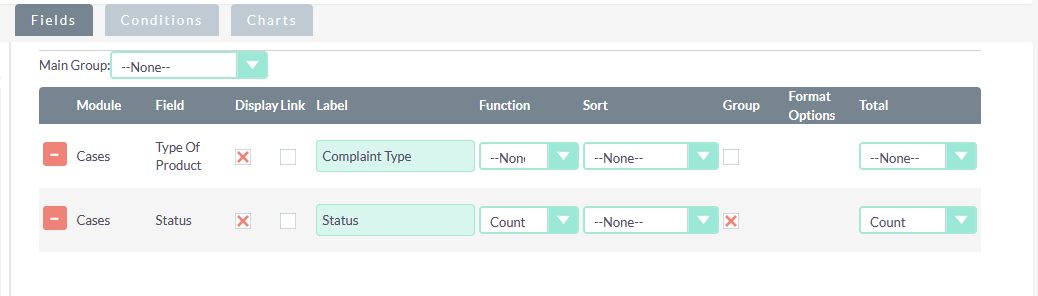
fields
try grouping by “type of product” and remove status.
then add the field cases : “ID” and count by this but do not group by it.
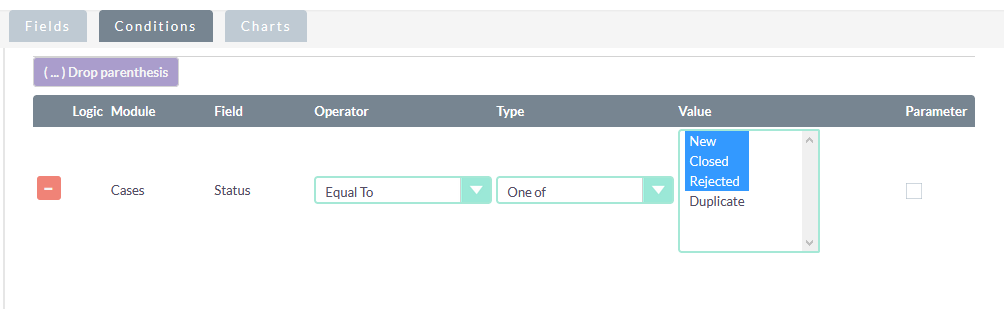
Conditions
leave as is
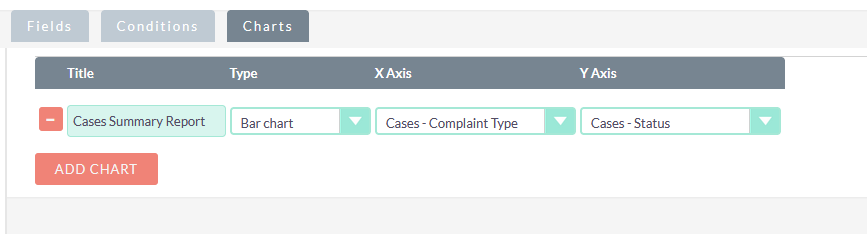
Chart
Change the Y Axis to ID
This worked for me, but the bar chart was missing colours, i changed it to a pie chart and could see the data.
If you group status and then count by it, you will end up with the total number of status options. So for instance it will group all of “new” as one item and then count it as one item, you need to count on a unique field like ID.
If you want multiple bars per a product then include status and group by it, but not count, leave the counting on the ID field.
Ok thank you, that helped alot. But can’t I differentiate the colors for each status?
Sorry i am not sure how to do that, the chart options looks pretty basic!
Ok thank you for your help
