Hello all
I have created one report for Converted Leads and add one (Pie Chart) but chart is not displaying in detail view when i am saving my report why is it so ?
Thank
Namit
Hello all
I have created one report for Converted Leads and add one (Pie Chart) but chart is not displaying in detail view when i am saving my report why is it so ?
Thank
Namit
Have you selected the chart when choosing the report within the dashlet?
E: sry, thought about dashlets.
Or within the report swap around the data inputs for the x and y axis.
Hello sir
yes i did that too
And did you have any luck?
Good morning sir
unfortunately no .
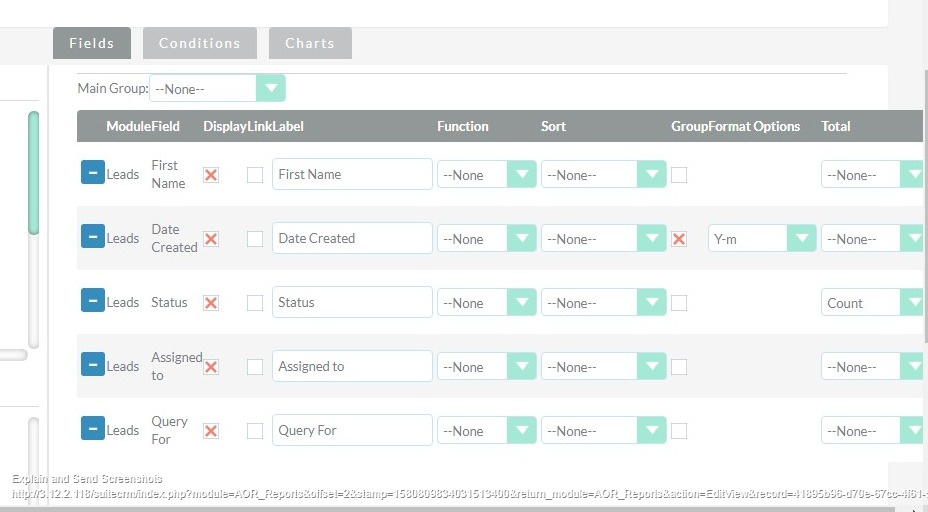
Screenshots please! Of configuration tabs and detail view also
Ye your data input is incorrect. What are you intending to do?
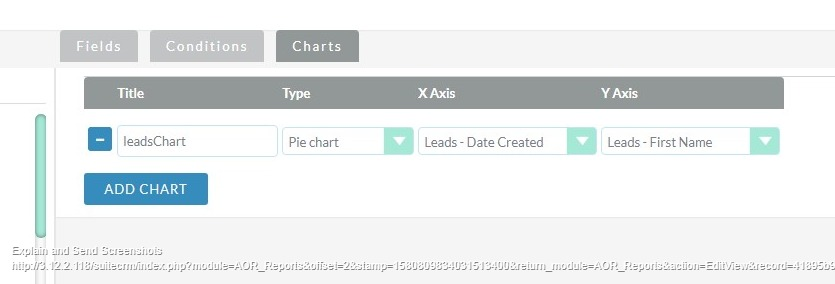
oh ok i am trying to show pie chart for above report on basis of date-created what is wrong ? Please tell
Pie Chart wont work for that, try using a line or stacked chart. You will also need to use Leads- Date Created against the count of ID to ensure for uniqueness. So pull in the ID coloum and set the function to count. then use that for the Y axis
How should a pie chart with the dimensions “date created” and “first name” look like? Seems not very intuitive to me.
Usually, you have some kind of category (lets say opportunity stage) and some kind of integer/float value (like count of opp’s or the sum of their amount).