Hello,
In report module I have several problem:
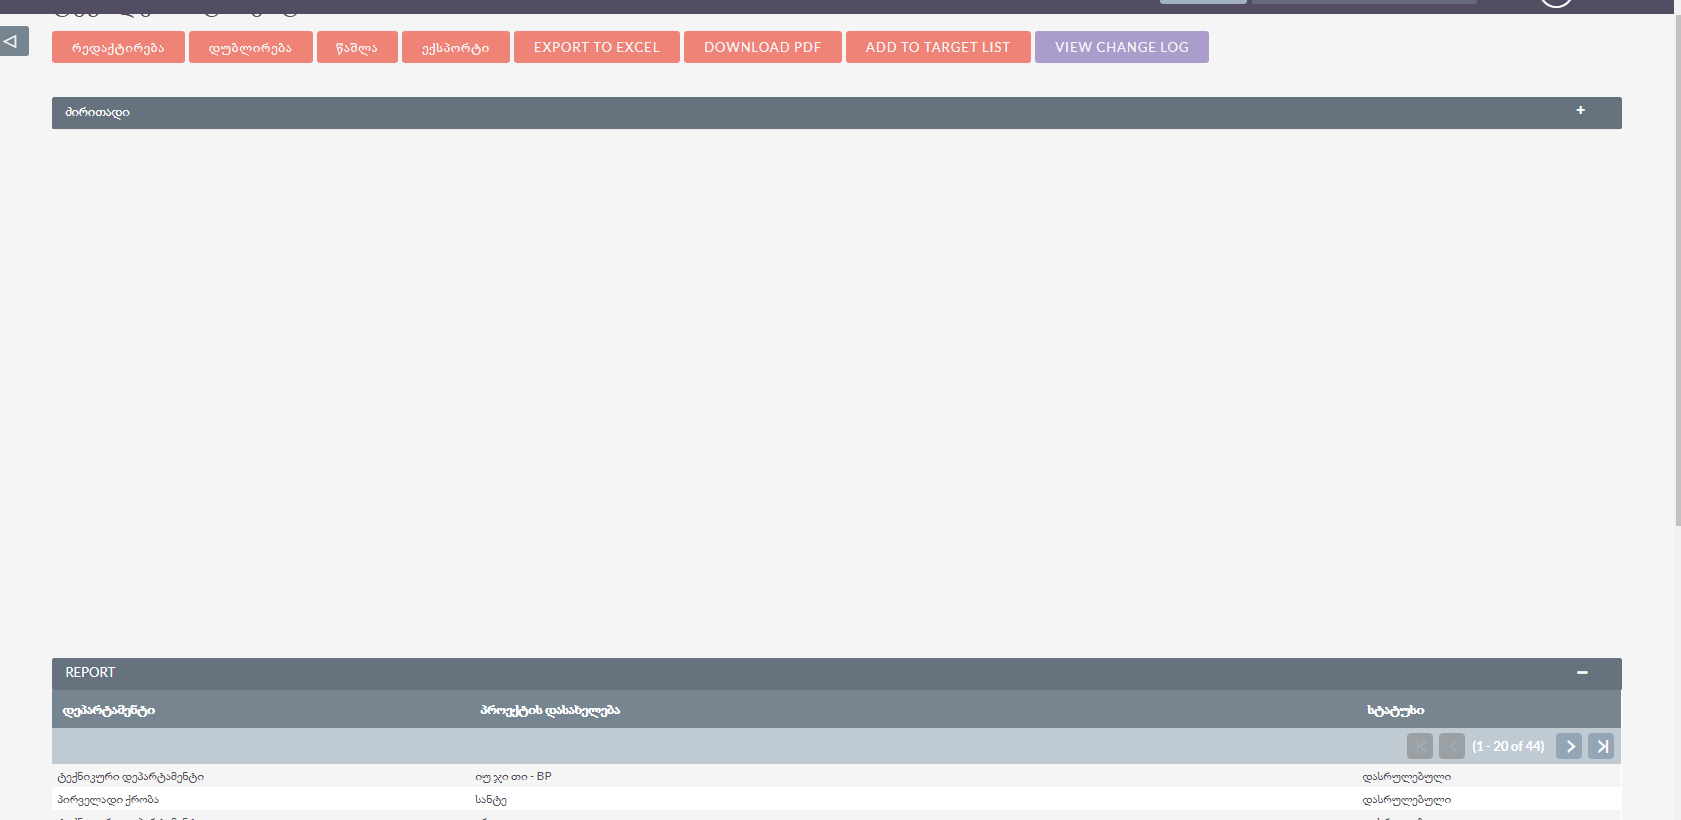
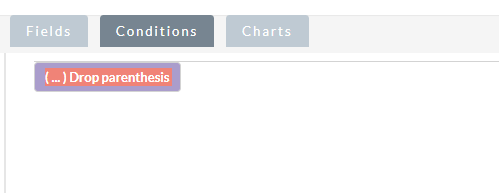
- There does not working Charts and Conditions . When I make charts It seems like screen 2 ( white space ).
Screen 1
Screen 2
In Conditions not work it does not get clicked.
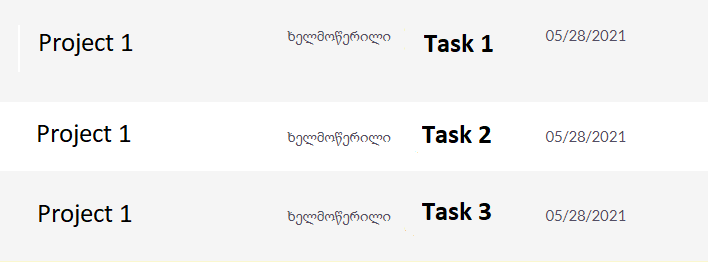
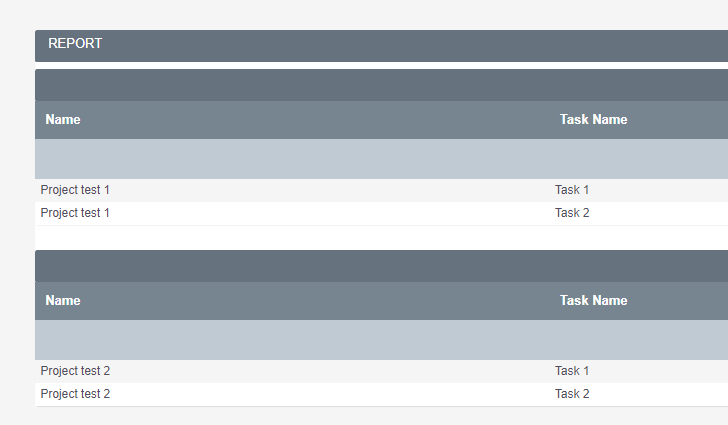
- In report, one record contains several sub-records, due to which the main records get duplicated.
For example : Project has several Project Tasks. When I output project tasks (if I have 3 tasks) and the project name gets duplicated as many times as the number of tasks in it (the project name is repeated three times). How can I fix this?
-
In Home page, when I add dashlets , in list there is not Report module:
-
Is there a way, in the report or on the main page, to display the existing in the projects module View Gantt

About version:
Version 7.11.18
Sugar Version 6.5.25 (Build 344)
This sounds like the desired behaviour, if you tried the same in a db query, there would be three lines too (unless you do a group by on the project and some kind of aggregation for the tasks).
Thank you for your answer!
How can I make group by in Suitecrm? Is it possible by Conditions?
Can anyone help me? Report module working with too much delay. 
Hi
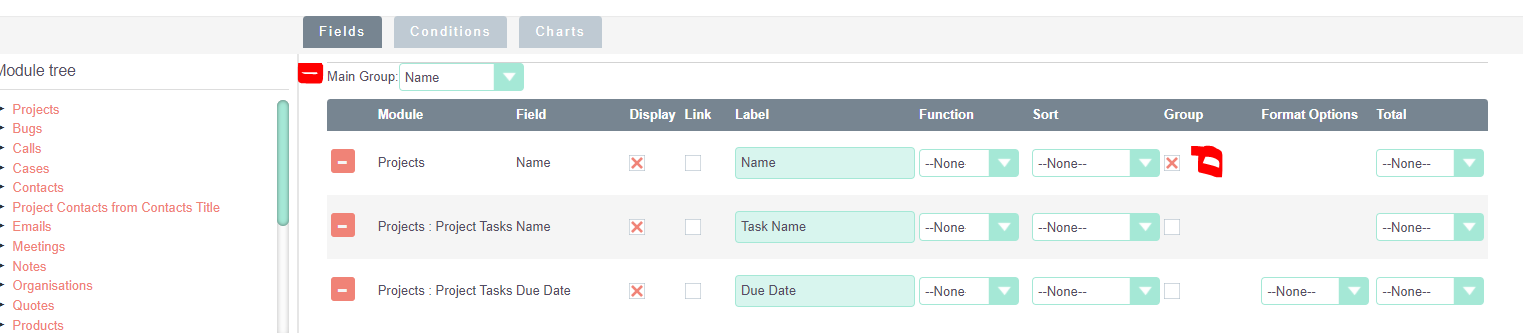
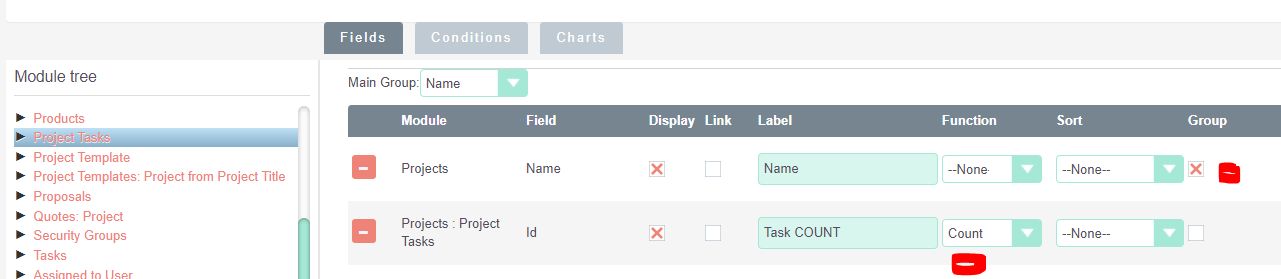
The main grouping will help but will not solve your issue
When creating the report tick the box group and select main group (fields panel)
You will still need ‘Project Name’ to be able to identify
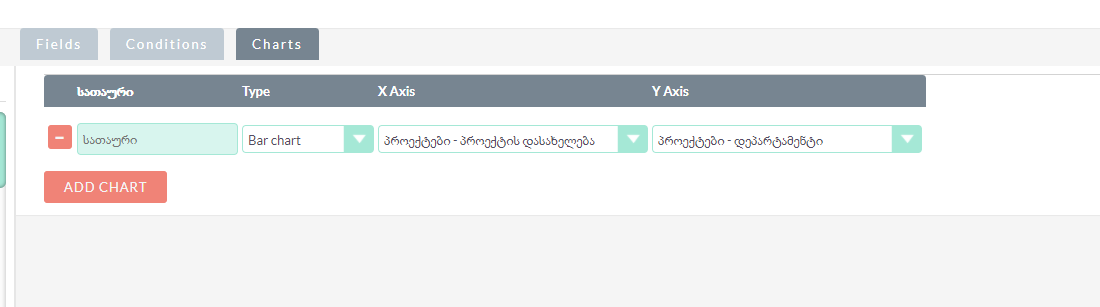
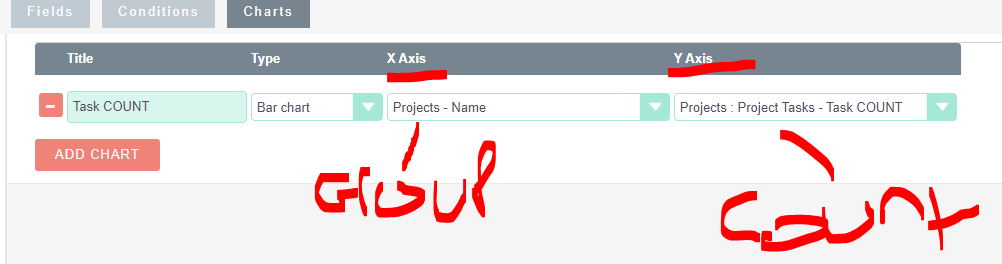
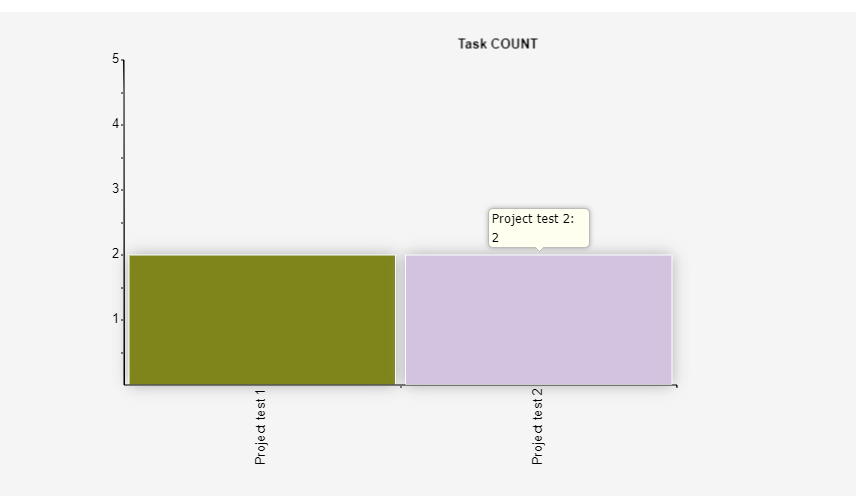
1 - Charts
These work on a COUNT basis
For example
When creating a chart, manage your X axis and Y axis (Y is always the COUNT field)
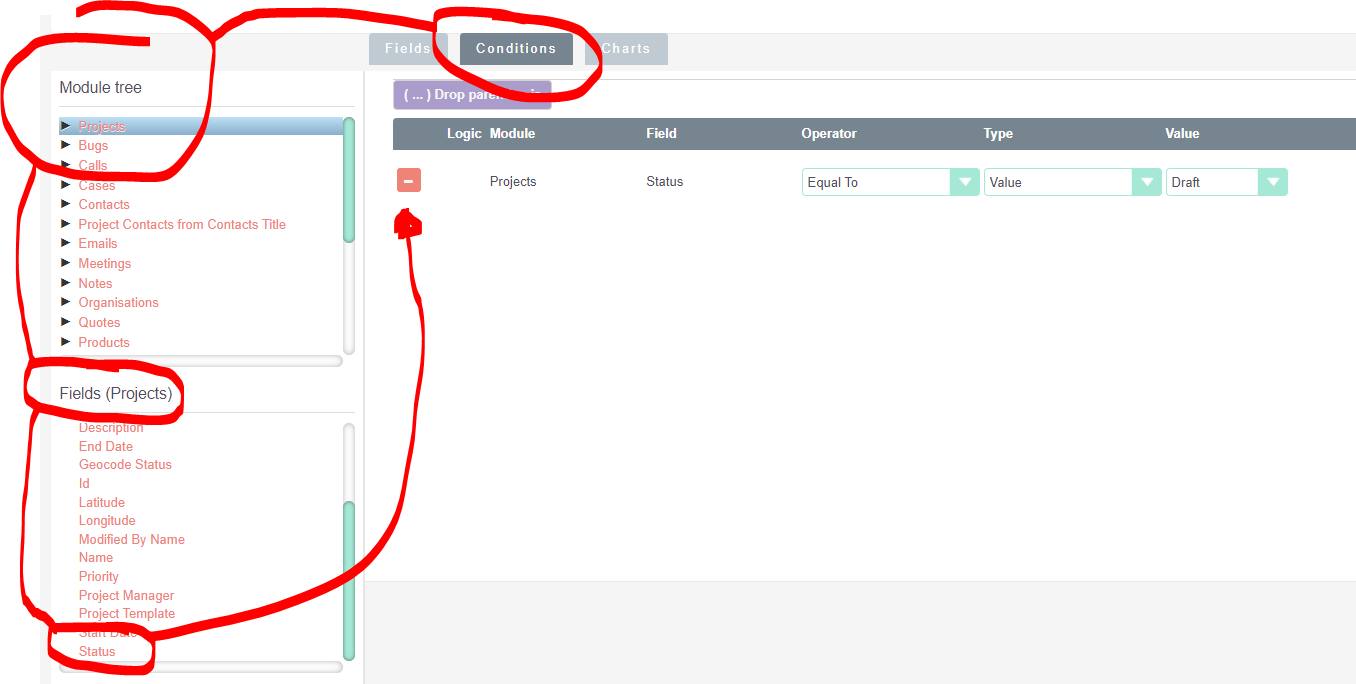
Conditions work the same as adding fields
Once on the tab, select the module and the field you want to use as the condition
in my example using the Project > status
Scroll down to the bottom
1 Like
In “ADD DASHLETS” there is not report module. Can I add from somewhere? Also, in CHARTS - how to modify input data?
Thank you!
Can you please explain in more detail what you mean
From my understanding if you want to modify the input data for a chart, you want a new report created with the new input fields
For example
Charts for Project and Project Tasks
Or
Charts for Project grouped by Type
These would be 2 reports, with 2 charts for different input
You could then create a dashboard tab on homepage and add both charts to the page
1 Like